
Source: www.flickr.com/photos/7702002@N08/2424198118
1. 할 일 목록 (To-do list) 온라인 서비스를 활용한다.
2. 모든 할 일을 기록한다. 사적인 것도.
3. 정말 끝난 일인지 생각한다.
4. 매일 할 일을 확인한다.
5. 정기적으로 기한과 우선 순위를 조정한다.
6. 반복 기능을 활용한다.
7. 무조건 그 시간에 해야 하는 일은 달력을 활용한다.
항상 알아도 잘 안되는 것은…
Source: www.flickr.com/photos/7702002@N08/2424198118
1. 할 일 목록 (To-do list) 온라인 서비스를 활용한다.
2. 모든 할 일을 기록한다. 사적인 것도.
3. 정말 끝난 일인지 생각한다.
4. 매일 할 일을 확인한다.
5. 정기적으로 기한과 우선 순위를 조정한다.
6. 반복 기능을 활용한다.
7. 무조건 그 시간에 해야 하는 일은 달력을 활용한다.
항상 알아도 잘 안되는 것은…
The root causes of performance problems can be very different and complex to locate, while the result is usually simple - slow or unavailable web site. Nodetime reveals the internals of your application and infrastructure through profiling and proactive monitoring enabling detailed analysis, fast troubleshooting, performance and capacity optimization.
Powerful profiling tools are essential for locating performance bottlenecks or optimizing application performance in production. Transaction Profiler, CPU and Memory Profiler are ready to be launched on the production application at any moment to give you a total visibility.
Monitor realtime and historical state of the application by following multiple application metrics. The metrics cover operating system state, garbage collection activity, application capacity, transactions and database calls for supported libraries, such as such as HTTP, File System, Socket.io, Redis, MongoDB, MySQL, PostgreSQL, Memcached and Cassandra.
Monitor databases used by your applications without any extra setup. Database status and statistics will be available along with other metrics to watch, analyze and trigger alerts. Currently Redis and MongoDB are supported.
It is important to get notified when an application is experiencing performance problems in order to prevent downtime and be able to quickly locate problem's root cause, while profiling exact problem symptoms, which might later disappear. Nodetime allows creating alerts for all the metrics of the application.


블룸버그에 테크밈의 창업자 가베 리베라(Gabe Rivera)의 인터뷰 기사(No VC: Why Techmeme’s Gabe Rivera Resists Investors)가 실렸습니다.
요즘 잘 나가는 IT뉴스 미디어 중 하나인 테크밈은 아직까지 외부 투자를 한 푼도 받지 않고 독자적으로 운영을 유지해 가고 있습니다.
돈이 많아서가 아니라 외부 투자로 인한 간섭을 피하고 자신만의 스타일로 서비스를 운영하고자 하는 소신을 가지고 있기 때문이죠.
큰 돈을 벌거나 전세계로 사업을 확장하고자 하는 욕심이 없습니다. 가베 리베라를 비롯해 전직원들이 자신의 일을 즐기며 안정적으로 서비스를 유지하는 것에 만족합니다.
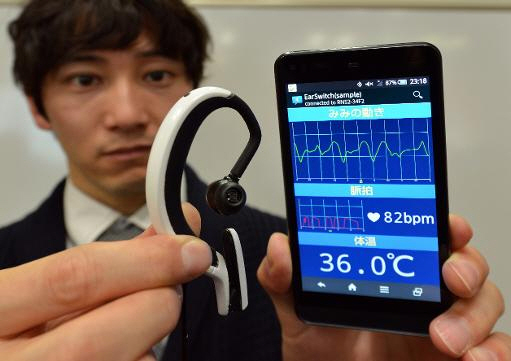
이어폰 형태의 초소형 '웨어러블' 컴퓨터가 일본 연구팀에 의해 개발됐다.
최근 AFP 통신을 비롯한 외신들은 일본 히로시마시립대학 연구팀이 개발한 '이어클립형 웨어러블 PC(Earclip-type Wearable PC) 시제품을 소개했다.
무게가 17g에 불과한 이 무선 기기는 블루투스와 호환되며, GPS, 컴파스, 자이로센서, 배터리, 기압계, 스피커, 마이크 기능 탑제 및 마이크로칩과 데이터 스토리지까지 탑제돼 있어 소프트웨어 구동도 가능한 것으로 알려졌다.
조작은 눈을 깜빡 거리거나 혀를 차는 소리, 기타 몸 움직임 등을 이용해 할 수 있으며 아이폰, 아이팟 등 모바일 기기와 연동도 지원한다.
연구팀은 오는 2015년 연말까지 개발을 완료하고 2016년 4월 상용화한다는 목표로 개발을 진행하고 있다.
Copyrightⓒ 넥스젠리서치(주) 케이벤치 미디어국. www.kbench.com
다른 서비스와 연동하면서 파일 관리까지 한 번에 할 수 있는 원드라이브(1Drive)는 Open API(Application Programmer Interface) 방식으로 누구나 접근할 수 있는 장점을 갖추고 여러 서비스와 연동할 수 있는 강력한 기능을 가진 친구입니다.
기존의 클라우드 서비스와 연결되었다는 것입니다. 페이스북을 비롯하여 박스, 드롭박스, 에버노트, 구글 드라이버, 인스타그램 등 SNS 채널과 함께 기타 서비스도 한번에 만날 수 있었습니다.
친구가 올린 콘텐츠까지 확인할 수 있더군요. 휘발성으로 잊혀질 줄 알았는데 몇 년간 페이스북에서 소통한 기록을 확인해볼 수 있어 좋은 경험으로 남게 되었습니다.

애플의 연락처 iOS 앱은 극히 기본적인 앱이다. 다행히 대안은 충분히 많고, 스마터 컨택트는 그 중에서도 최고의 앱 중 하나다. 아웃룩, 지메일, 야후 메일, 아이클라우드 이메일 계정을 트위터 및 페이스북 네트워크와 함께 연결할 수 있다. 연결하면 스마터 컨택트가 각 연락처에 대한 "전체적인" 시각을 제공한다. 여기에는 해당 연락처에 메시지를 보낸 시점을 포함한 이메일 내역과 두 사람의 공통된 연락처 목록도 포함된다. 모든 정보는 깔끔한 인터페이스를 통해 전달되며, 이메일과 소셜 네트워크를 연결한 후 처음 수행되는 데이터 스캔 속도도 매우 빠르다. 다만 링크드인이 통합된, 아이패드에 최적화된 업데이트가 나온다면 더 좋을 듯하다.
https://itunes.apple.com/app/smartr-contacts-for-iphone/id492744572?mt=8

시리와 구글 나우는 가장 인기 있는 모바일 가상 비서다. 그러나 이질리두가 더 많은 기능을 제공한다. 예를 들어 이 앱은 연락처에서 중복 항목을 검색해서 하나로 합쳐준다. 예정된 약속 장소로 가는 길안내도 받을 수 있다. 특정 단어나 문구가 포함된 이메일을 받을 경우 알림을 수신할 수 있다(예를 들어 "대금 지급" 등). 또한 소포를 추적하고 현지 날씨 업데이트를 자동으로 수신하는 기능도 있다. iOS 버전은 무료 아이튠즈 앱과 이주의 싱글(음악)도 알려준다. 무료로 많은 업무용 기능을 제공하는 앱으로, 흠잡을 부분이 거의 없다.
https://itunes.apple.com/za/app/easilydo-smart-assistant/id481881465?mt=8
https://www.atlassian.com/software/jira
JIRA demo video(한글자막)
https://www.youtube.com/watch?v=xrCJv0fTyR8
Editing Project Workflows in JIRA
https://www.youtube.com/watch?v=DLrWrpY8mIs
Scrum planning and reporting demo video
https://www.youtube.com/watch?v=1zL3Sfjr4W0#t=92
JIRA import workflow
https://www.youtube.com/watch?v=2TOR3Y13hH0
New JIRA mobile interface
https://www.youtube.com/watch?v=lekTq-kg9gY
Atlassian Software Development Workflow
https://www.youtube.com/watch?v=OMLh-5O6Ub8
Integrating JIRA issues with FishEye Source and Crucible Code Reviews
https://www.youtube.com/watch?v=fFQ4MWQTO4Q
https://www.atlassian.com/software/jira/agile
JIRA Agile – Truly Agile
https://www.youtube.com/watch?v=KdyV9okLRlc
https://www.atlassian.com/software/confluence
Confluence Team Collaboration Software Overview Video
https://www.youtube.com/watch?v=xrCJv0fTyR8
Introduction to the Confluence Editor
https://www.youtube.com/watch?v=5y41OWc9o7s
Do Agile Right with Atlassian JIRA and Confluence
https://www.youtube.com/watch?v=cmZYGAvpxQc
Meeting Notes Blueprint Video for Confluence https://www.youtube.com/watch?v=2B4cl1p07zE
File List Blueprint Video for Confluence
https://www.youtube.com/watch?v=oJp2era_sug
Confluence Decisions Blueprint Video
https://www.youtube.com/watch?v=P2PK6vfF9hk
Confluence Shared Links
https://www.youtube.com/watch?v=uxqsaWldo00
Confluence Task Management
https://www.youtube.com/watch?v=jpSfXkUTSSc
Produect Requirements
https://www.youtube.com/watch?v=I2vY6FKeXbs
Quick JIRA Issue Creation in Confluence
https://www.youtube.com/watch?v=reiLHEIlXDc
Publish JIRA Reports in Confluence
https://www.youtube.com/watch?v=nsx7brbcL-M
Run Retrospectives in Confluence
https://www.youtube.com/watch?v=x6l7toqpoEQ
Confluence Knowledge Base
https://www.youtube.com/watch?v=cS_bbyLQpjQ
https://www.atlassian.com/software/confluence/team-calendars
Team Calendars for Confluence
추가
출처 : http://blog.naver.com/ratis0/150164983877

다른 무소음 컴퓨터를 보면 케이스를 통풍이 완전 잘되는 케이스로 해서 쿨러없이 사용을 많이 하더군요.. 대표적으로 NOFAN 사의 자연대류형 케이스가 그렇습니다.
하드소음방지케이스인 아이스쿨러 란게 있긴한데... 써봤긴했는데 좀 덜 들린다뿐이지 들리는건 어쩔수가 없습니다. 그렇기에 해결책은 SSD 밖에 없습니다.
처음은 노팬사의 흑진주 쿨러를 선택했습니다. 실제로 팬이 없는상태의 쿨링성능은 가장 좋고 처음부터 팬이 없이 동작하는것을 기준으로 만들어진제품이기에 선택을 하게 되었지요. 하!지!만! 저 자비없는 가격은.... 납득하기 힘들었고 다른 좋은 쿨러가 없을까? 하고 다른 쿨러들을 찾다가 보게된것이 HR-02 입니다.
파워를 선택을 해야하는 상황에서 후보로 떠오른
SuperFlower SF-500P14PE GOLDEN KING
을 말이죠!! 이걸 보게된 계기는 가성비 킹왕짱이라고 적은 쿨앤조이의 댓글때문이였는데... 처음 신경도 안쓴건 사진에 뻔히 보이는 팬때문이였죠.. 무소음을 지향하는 판국에 팬이 회전하면 아무런 의미가 없다! 라 생각을 했었는데 자세한 성능을 보다보니 보이는 기능중 하나가 저소음모드에서는 80도미만에서는 팬이 작동하지 않는다


JS Plugin Download
http://repository.codehaus.org/org/codehaus/sonar-plugins/javascript/sonar-javascript-plugin/1.5/sonar-javascript-plugin-1.5.jar 를 SONARQUBE_HOME/extensions/plugins 에 다운 받는다.
$ wget http://repository.codehaus.org/org/codehaus/sonar-plugins/javascript/sonar-javascript-plugin/1.5/sonar-javascript-plugin-1.5.jar
--2014-03-01 12:40:28-- http://repository.codehaus.org/org/codehaus/sonar-plugins/javascript/sonar-javascript-plugin/1.5/sonar-javascript-plugin-1.5.jar
Resolving repository.codehaus.org (repository.codehaus.org)... 199.193.192.103
Connecting to repository.codehaus.org (repository.codehaus.org)|199.193.192.103|:80... connected.
HTTP request sent, awaiting response... 200 OK
Length: 728235 (711K) [application/java-archive]
Saving to: `sonar-javascript-plugin-1.5.jar'100%[=================================================>] 728,235 362K/s in 2.0s
2014-03-01 12:40:31 (362 KB/s) - `sonar-javascript-plugin-1.5.jar' saved [728235/728235]
SonarQube restart
~$ sudo /etc/init.d/sonar restart
Stopping sonar...
Stopped sonar.
Starting sonar...
Started sonar.
Confirm Java script Plugin

SonarQube Runner Download
~$ wget http://repo1.maven.org/maven2/org/codehaus/sonar/runner/sonar-runner-dist/2.3/sonar-runner-dist-2.3.zip
--2014-03-01 13:22:01-- http://repo1.maven.org/maven2/org/codehaus/sonar/runner/sonar-runner-dist/2.3/sonar-runner-dist-2.3.zip
Resolving repo1.maven.org (repo1.maven.org)... 199.27.77.129, 199.27.77.192
Connecting to repo1.maven.org (repo1.maven.org)|199.27.77.129|:80... connected.
HTTP request sent, awaiting response... 200 OK
Length: 303046 (296K) [application/zip]
Saving to: `sonar-runner-dist-2.3.zip'100%[=================================================>] 303,046 454K/s in 0.7s
2014-03-01 13:22:03 (454 KB/s) - `sonar-runner-dist-2.3.zip' saved [303046/303046]
Uncompress the downloaded file into the directory of your choice.
자기가 받고자 하는 경로에 다운 받아서 압축을 풉니다.
~$ cd /opt/
/opt$ sudo unzip /home/ubuntu/sonar-runner-dist-2.3.zip
Archive: /home/ubuntu/sonar-runner-dist-2.3.zip
creating: sonar-runner-2.3/
creating: sonar-runner-2.3/bin/
inflating: sonar-runner-2.3/bin/sonar-runner.bat
inflating: sonar-runner-2.3/bin/sonar-runner
creating: sonar-runner-2.3/conf/
inflating: sonar-runner-2.3/conf/sonar-runner.properties
creating: sonar-runner-2.3/lib/
extracting: sonar-runner-2.3/lib/sonar-runner-dist-2.3.jar
Setup SonarQube Runner
editing <install_directory>/conf/sonar-runner.properties
$ sudo vi conf/sonar-runner.properties
#----- Default SonarQube server
sonar.host.url=http://localhost:9000
#----- MySQL sonar.jdbc.url=jdbc:mysql://localhost:3306/sonar?useUnicode=true&characterEncoding=utf8
Add the <install_directory>/bin directory to your path.
path에 sonar_runner 추가
Download example code
$ wget https://github.com/SonarSource/sonar-examples/archive/maste
r.zip
--2014-03-01 13:07:40-- https://github.com/SonarSource/sonar-examples/archive/master.zip
Resolving github.com (github.com)... 192.30.252.129
Connecting to github.com (github.com)|192.30.252.129|:443... connected.
HTTP request sent, awaiting response... 302 Found
Location: https://codeload.github.com/SonarSource/sonar-examples/zip/master [following]
--2014-03-01 13:07:41-- https://codeload.github.com/SonarSource/sonar-examples/zip/master
Resolving codeload.github.com (codeload.github.com)... 192.30.252.145
Connecting to codeload.github.com (codeload.github.com)|192.30.252.145|:443... connected.
HTTP request sent, awaiting response... 200 OK
Length: unspecified [application/zip]
Saving to: `master.zip'[ <=> ] 984,865 476K/s in 2.0s
2014-03-01 13:07:44 (476 KB/s) - `master.zip' saved [984865]
~$ unzip master.zip
Archive: master.zip
a0bcc5083d5099bc49da4ebbfbdc5b15f4aa9033
creating: sonar-examples-master/
inflating: sonar-examples-master/.gitignore
inflating: sonar-examples-master/README.md
creating: sonar-examples-master/plugins/~$ cd sonar-examples-master/projects/languages/javascript/javascript-sonar-runner
To run an analysis of your JavaScript project, use the SonarQube Runner.
~/sonar-examples-master/projects/languages/javascript/javascript-sonar-runner$ /opt/sonar-runner-2.3/bin/sonar-runner
SonarQube Runner 2.3
Java 1.7.0_51 Oracle Corporation (64-bit)
Linux 3.2.0-58-virtual amd64
INFO: Runner configuration file: /opt/sonar-runner-2.3/conf/sonar-runner.properties
INFO: Project configuration file: /home/ubuntu/sonar-examples-master/projects/languages/javascript/javascript-sonar-runner/sonar-project.properties
INFO: Default locale: "en_US", source code encoding: "UTF-8"
INFO: Work directory: /home/ubuntu/sonar-examples-master/projects/languages/javascript/javascript-sonar-runner/.sonar
INFO: SonarQube Server 4.1.113:13:28.908 INFO - <- Clean snapshot 4
INFO: ------------------------------------------------------------------------
INFO: EXECUTION SUCCESS
INFO: ------------------------------------------------------------------------
Total time: 38.092s
Final Memory: 12M/115M
INFO: ------------------------------------------------------------------------
결과 확인하기

http://docs.codehaus.org/display/SONAR/JavaScript+Plugin
http://docs.codehaus.org/display/SONAR/Installing+and+Configuring+SonarQube+Runner

Make file (파일 만들기)
~$ sudo dd if=/dev/zero of=/var/swapfile bs=1M count=2048
2048+0 records in
2048+0 records out
2147483648 bytes (2.1 GB) copied, 58.9169 s, 36.4 MB/s
Change file mode (파일 모드 변경)
sudo chmod 600 /var/swapfile
Set up swap area(swap 파일 설정)
~$ sudo mkswap /var/swapfile
Setting up swapspace version 1, size = 2097148 KiB
no label, UUID=969aa5a8-9fd8-4ab3-82b6-e20f23efc081
add to fstab (fstab에 등록)
sudo echo /var/swapfile none swap defaults 0 0 | sudo tee -a /et
c/fstab
/var/swapfile none swap defaults 0 0~$ cat /etc/fstab
LABEL=cloudimg-rootfs / ext4 defaults 0 0
enable file for paging and swapping (swap 실행)
~$ sudo swapon –a
~$ free
total used free shared buffers cached
Mem: 604332 586984 17348 0 5828 521648
-/+ buffers/cache: 59508 544824
Swap: 2097148 0 2097148
The only prerequisite for running SonarQube is to have Java (Oracle JRE 6 onwards) installed on your machine.
http://docs.codehaus.org/display/SONAR/Requirements
Install JAVA7 (자바 7 설치)
ubuntu@ip-172-31-31-224:~$ sudo apt-get install openjdk-7-jre
Reading package lists... Done
Building dependency tree
Reading state information... Done
The following extra packages will be installed:
0 upgraded, 138 newly installed, 0 to remove and 3 not upgraded.
Need to get 79.2 MB of archives.
After this operation, 181 MB of additional disk space will be used.
Do you want to continue [Y/n]?
Install MySQL (mysql 설치)
~$ sudo apt-get install mysql-server
Reading package lists... Done
Building dependency tree
Reading state information... Done
The following extra packages will be installed:
libdbd-mysql-perl libdbi-perl libhtml-template-perl libmysqlclient18 libnet-daemon-perl
libplrpc-perl libterm-readkey-perl mysql-client-5.5 mysql-client-core-5.5 mysql-common
mysql-server-5.5 mysql-server-core-5.5
Suggested packages:
libipc-sharedcache-perl tinyca mailx
The following NEW packages will be installed:
libdbd-mysql-perl libdbi-perl libhtml-template-perl libmysqlclient18 libnet-daemon-perl
libplrpc-perl libterm-readkey-perl mysql-client-5.5 mysql-client-core-5.5 mysql-common
mysql-server mysql-server-5.5 mysql-server-core-5.5
0 upgraded, 13 newly installed, 0 to remove and 3 not upgraded.
Need to get 27.2 MB of archives.
After this operation, 97.5 MB of additional disk space will be used.
Do you want to continue [Y/n]?
Installing the DataBase (DB설치)
make sample scripte for mysql
~$ vi create_database.sql
# Create SonarQube database and user.
#
# Command: mysql -u root -p < create_database.sql
#CREATE DATABASE sonar CHARACTER SET utf8 COLLATE utf8_general_ci;
CREATE USER 'sonar' IDENTIFIED BY 'sonar';
GRANT ALL ON sonar.* TO 'sonar'@'%' IDENTIFIED BY 'sonar';
GRANT ALL ON sonar.* TO 'sonar'@'localhost' IDENTIFIED BY 'sonar';
FLUSH PRIVILEGES;
create database
~$ mysql -u root -p < create_database.sql
Enter password: <—insert your root passwd of mysql
Add the following entry in your /etc/apt/sources.list :
deb http://downloads.sourceforge.net/project/sonar-pkg/deb binary/
Update your local package index and install Sonar:
sudo apt-get update
sudo apt-get install sonar
Those packages install standalone version of Sonar into "/opt/sonar" and provide init script, so it can be launched as:
/etc/init.d/sonar start
Change Database
sudo vi /opt/sonar$ sudo vi conf/sonar.properties
#sonar.jdbc.url=jdbc:h2:tcp://localhost:9092/sonar
#----- MySQL 5.x
# Comment the embedded database and uncomment the following line to use MySQL
sonar.jdbc.url=jdbc:mysql://localhost:3306/sonar?useUnicode=true&characterEncoding=utf8&rewriteBatchedStatements=true
Restart
$ sudo /etc/init.d/sonar restart
Starting sonar...
Started sonar.

http://sonar-pkg.sourceforge.net/
http://docs.codehaus.org/display/SONAR/Installing
http://www.chrishjorth.com/blog/free-aws-ec2-ubuntu-apache-php-mysql-setup/


